Chart Crime Studio
Turn a 2.7-point lead into a generational leap. Drag the y-axis baseline until the difference looks like a launch post. Tufte's Lie Factor is computed live, so you know exactly how much you are lying.
TrustMeBench Pro (Verified)
Accuracy, %, higher is better
*Our model: pass@64, majority vote, internal harness, temperature tuned per question, excluding the 31 questions it got wrong. Competitor: as reported by a user on Reddit.
- Actual difference
- +2.7 pts +5.4% relative
- Visual difference
- 1.05× our bar vs. theirs
- Lie Factor (Tufte)
- 1.0 1.0 is honest
- Verdict
- Honest Nobody will share this.
The Lie Factor
Edward Tufte defined the Lie Factor as the size of an effect shown in a graphic divided by the size of the effect in the data. A value of 1 is honest. Values above 1.05 are, in his words, substantial distortion. Values above 10 are a product launch.
where effect = (ours − theirs) / theirs, measured on bar height for the graphic and on the score for the data.
Found in the wild
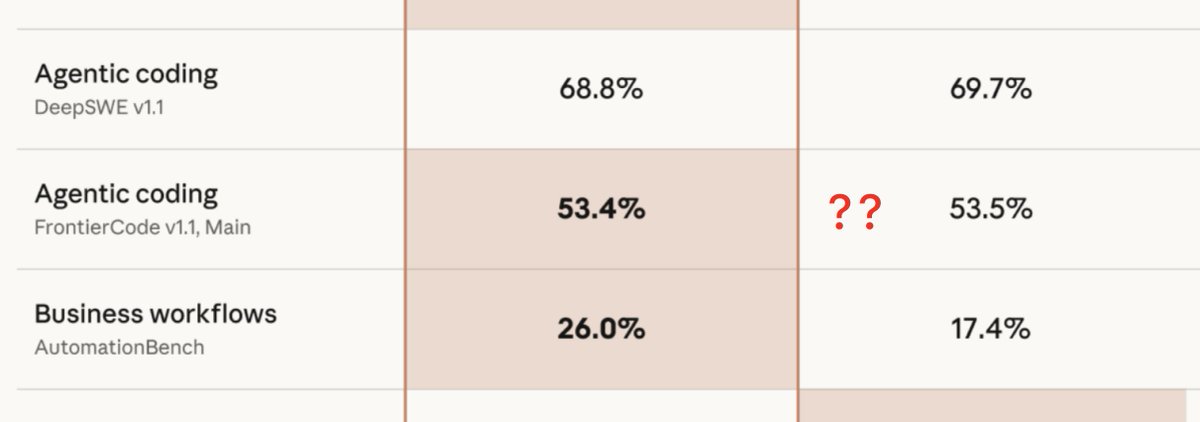
Real posts about real charts. The studio above was built so you can reproduce these results at home.